This baseline speed test was used to confirm that the results of the fist speed run were fairly consistent. Stephane was asked to do his best effort to improve match or improve his first speed test run. The following results were derived from his effort. Please click on “Continue Reading —>” if the Overall Performance Data Chart and the Test Summary are not readily displayed for your viewing.
Test Results
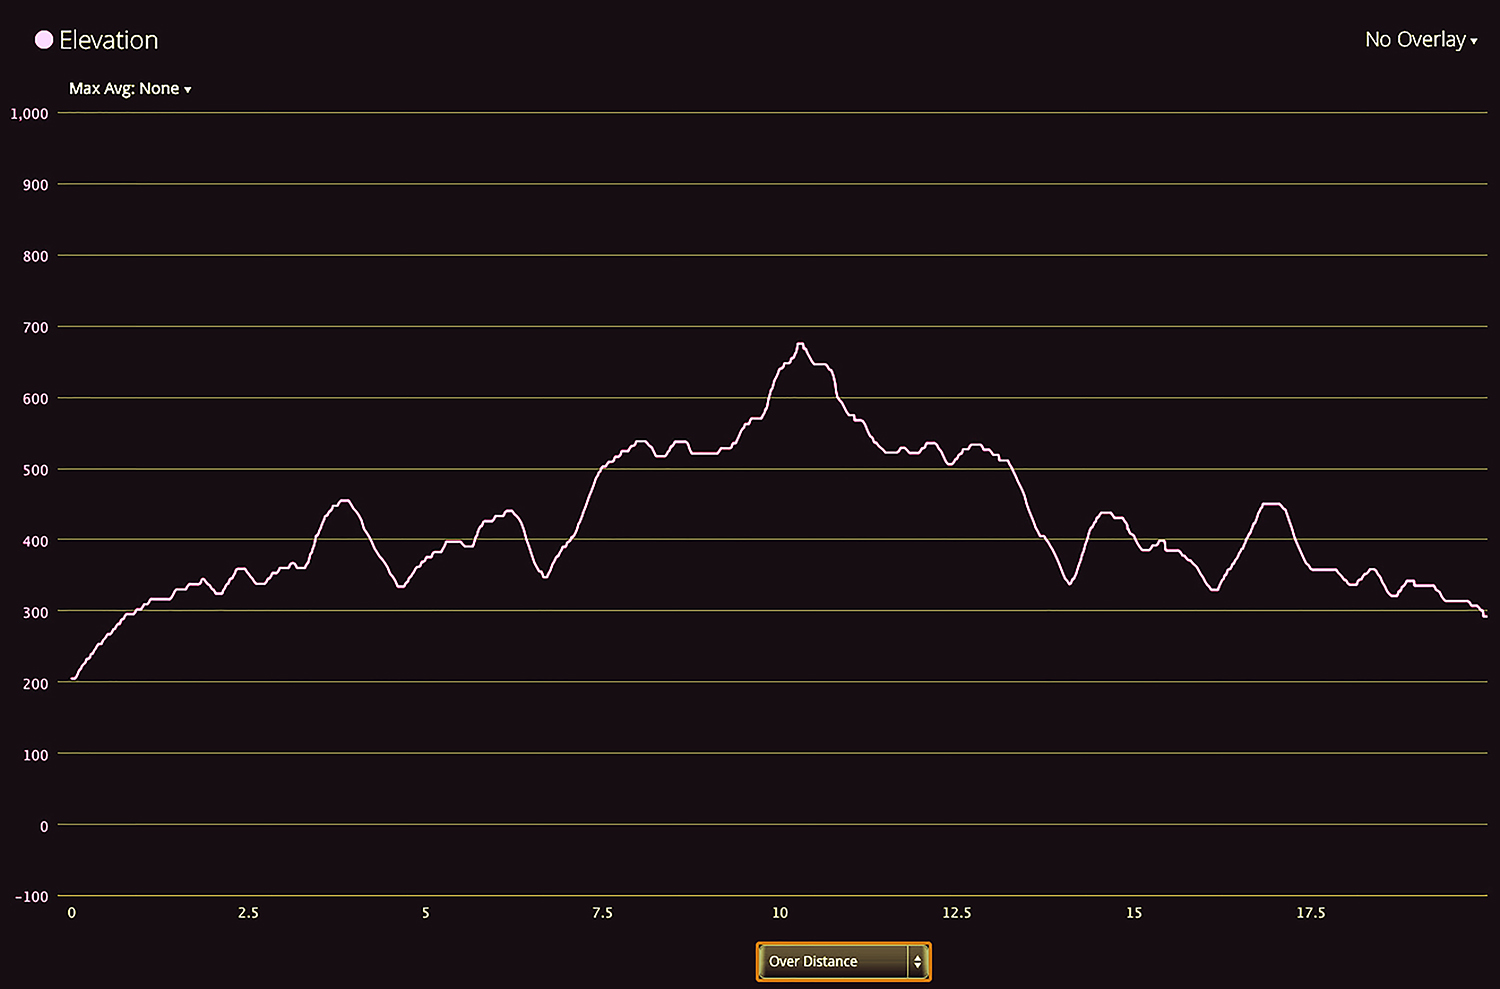
Terrain Profile
Power Data Values

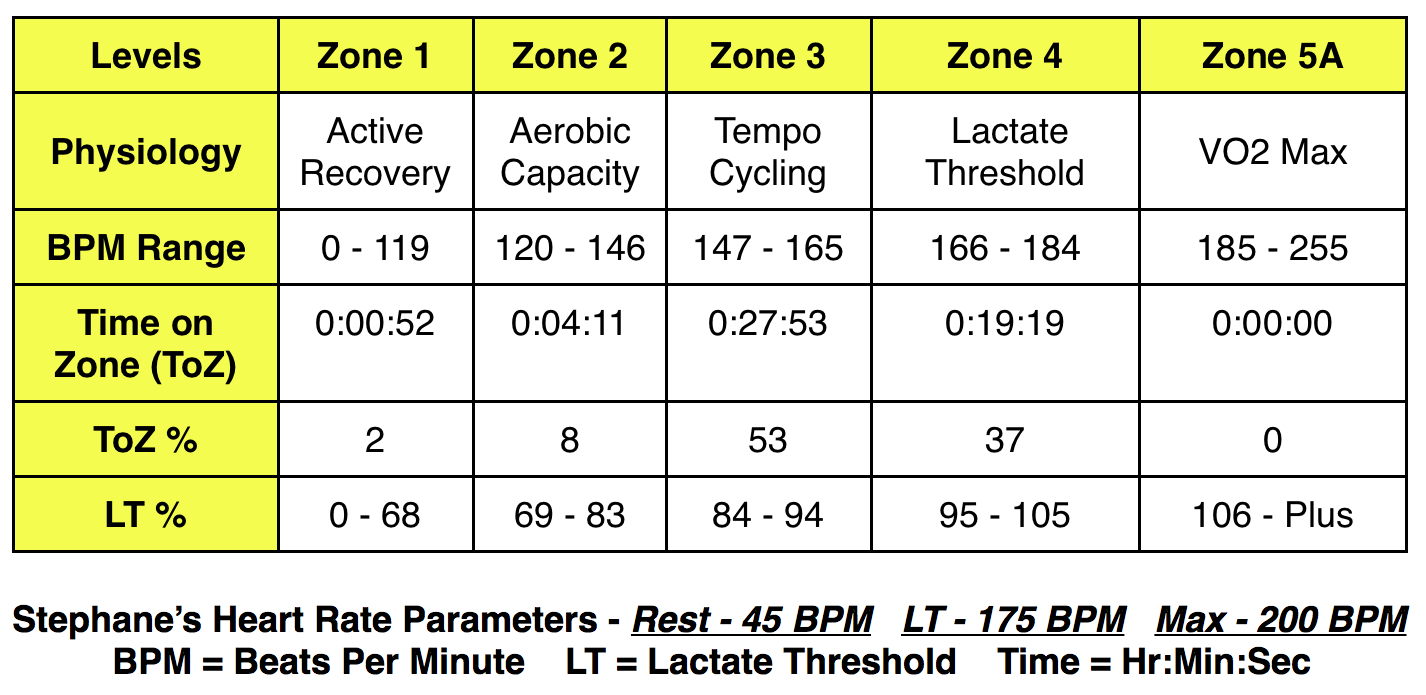
Heart Rate Data Values
Overall Performance Data

Second Speed Test Run Summary
Stephane was able to achieve an effort consistent with that of a Hill Climbing Time Trial or a Flat Criterium. At a value of 304 Watts, his Normalized Power for the test was equivalent to 95% of his Functional Threshold Power output of 320 Watts. There was no question that he produced a very strong effort during the test. His intensity factor was at Lactate Threshold and his Training Stress Test score was 74.5. He generated a pedaling work value of 867 Kilojoules. This run was going to be fundamental in order to compare it to an LPP test run in order to assess the its LPP’s efficiency at a race pace performance level.
