LPP Baseline Test on Track #1
For this fist test, Stephane was asked to go through the test track as fast as possible. He used his pedaling technique for this effort to establish a baseline test time. . We used the Garmin Connect and Training Peaks data analysis platforms to provide the results. We based the performance zones on the Coggan Power and Heart Rate Zones method. This method relies on power and heart rate at Lactate Threshold to derive the performance metrics. Please click on “Continue Reading —>” if the Overall Performance Data Chart and the Test Summary are not readily displayed for your viewing.
Test Results
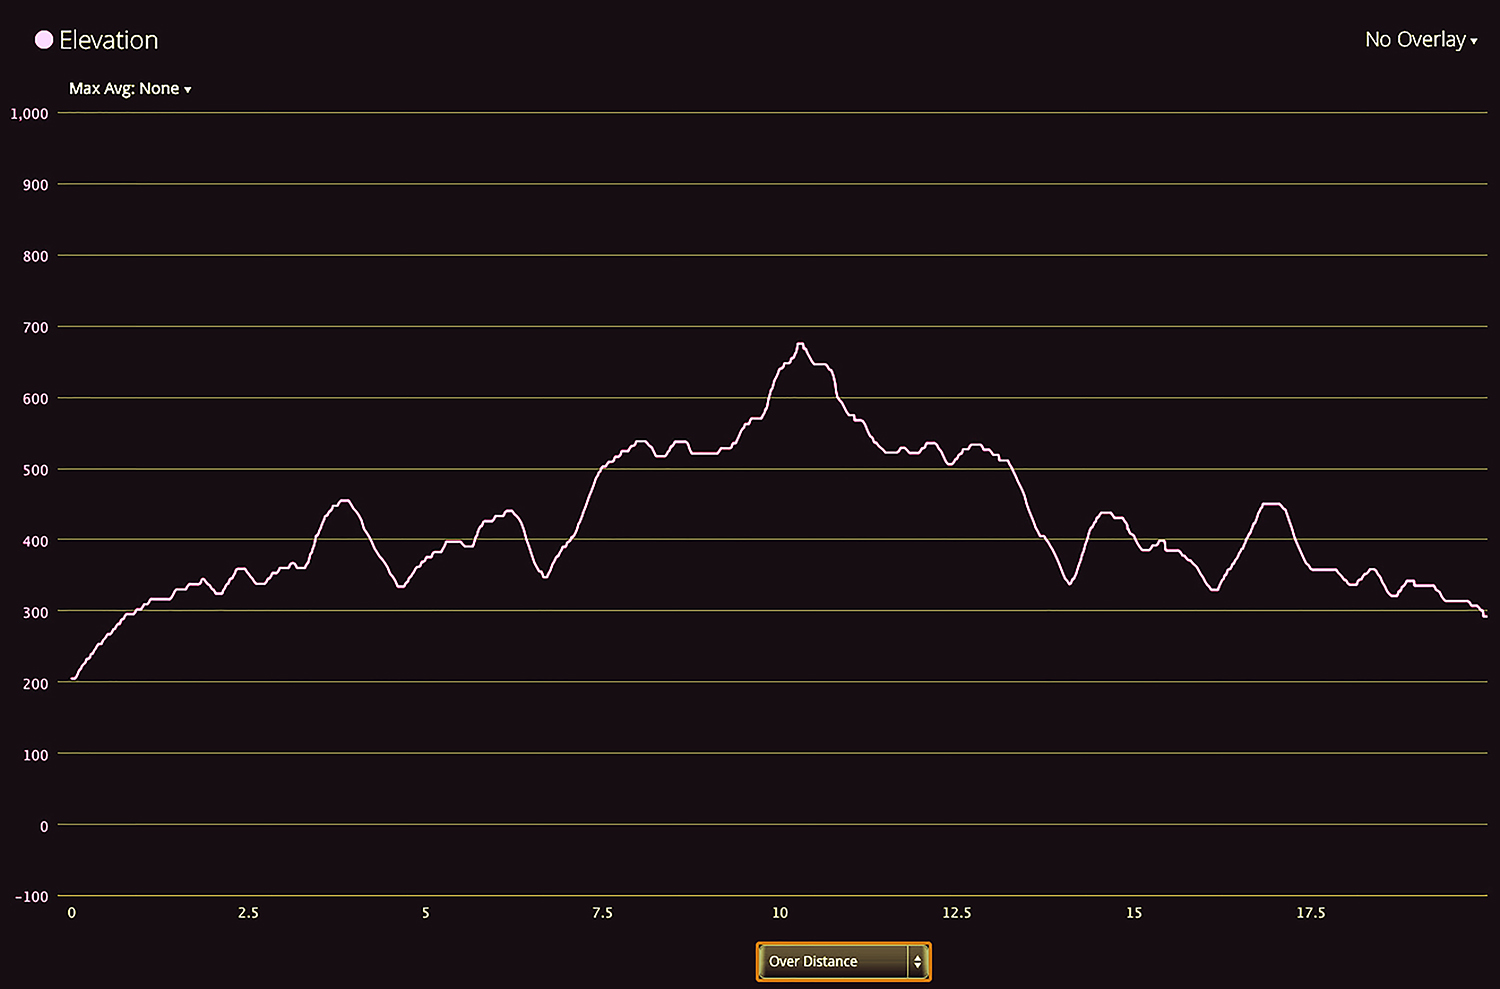
Terrain Profile
Power Data Values

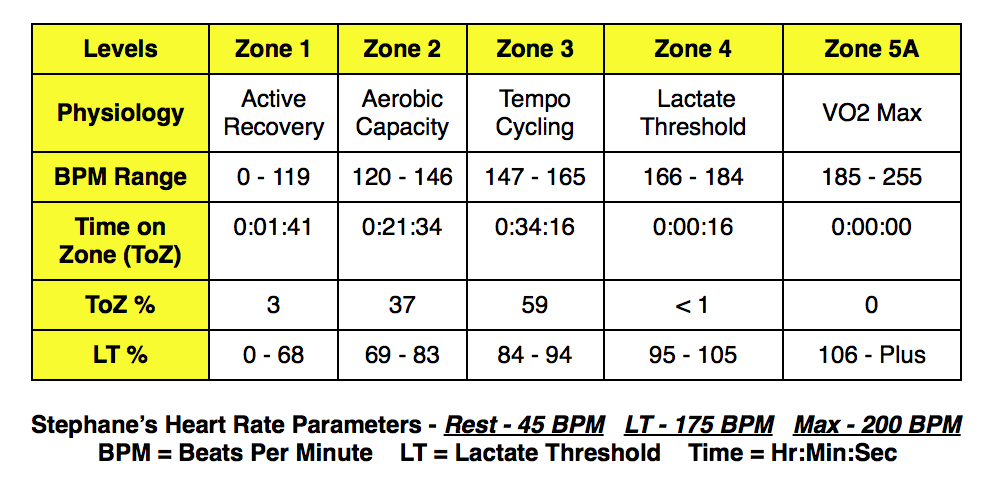
Heart Rate Data Values
 Double Click on Image to Expand for Clarity
Overall Performance Data
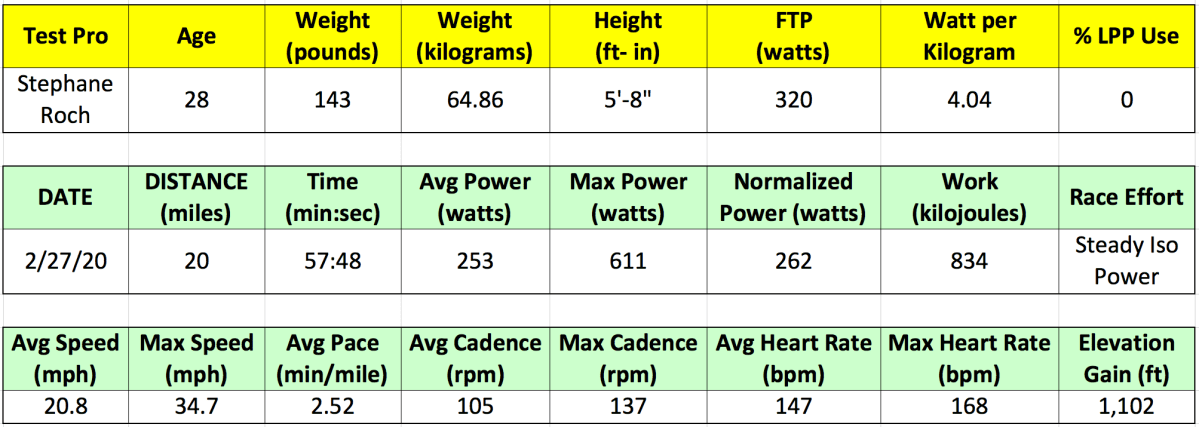
First Baseline Track Speed Test Summary
The results of this first test clearly show the competitive power generation capacity of this technique at a level that hit the 6 power zones, while producing a Normalized power value mid range within the Tempo Zone yet with an average heart rate level at the lowest possible value of the Tempo Zone. Power generation up to 600 watts with sustained segments upward of 300 watts were not problematic to achieve. When analyzed from an overall performance level, even the Intensity Factor (IF) value was consistent with the upper limits of the Endurance zone, which meant that Stephane could have pushed the technique harder, however, the intent was to baseline the technique in a conservative and bounded manner before demanding more of it. That was clearly achieved.
