Post # 8 – End of Testing Observations

Test and Usage Based Observations

Our testing efforts as well as long term usage of LPP shows that  a properly executed LPP techniques (exerting pedaling force only by pulling from the 6:15 O’clock to the 11:45 O’clock position)  promotes full adaptation of the “lifting” muscles. All other pedaling techniques do not use the lifting muscles to their full potential. To the extent that those muscles are not used,  a considerable source of muscle power can be left untapped. The reason relates to muscle count.  Nine muscles are directly engaged and four core muscles indirectly support the lifting effort. That is a total of Thirteen muscles.  Hardly any of those muscles are being used by pure pedal pushers, who rely solely on seven muscles to do the pushing job. The sheer lack of muscle power makes push pedaling harder. In addition, those hooked on pure pedal pushing also have to overcome the weight and  motion opposition of an ascending leg that is basically useless and just going for the ride during the pushing technique. That ascending leg adds weight and due to the force of gravity  does not want to bend upward. Please bear in this in mind when you are temped to just push down on pedals. It is a passable technique when you are descending or have a tail wind helping you. It is a lousy pedaling technique when you face head and cross wind or you have to do climbing. It is also lousy for promoting high rpm pedaling, which is more efficient in generating power during cycling because it relies more on your cardio system and in doing so, it saves critical muscle power necessary for better long range performance.

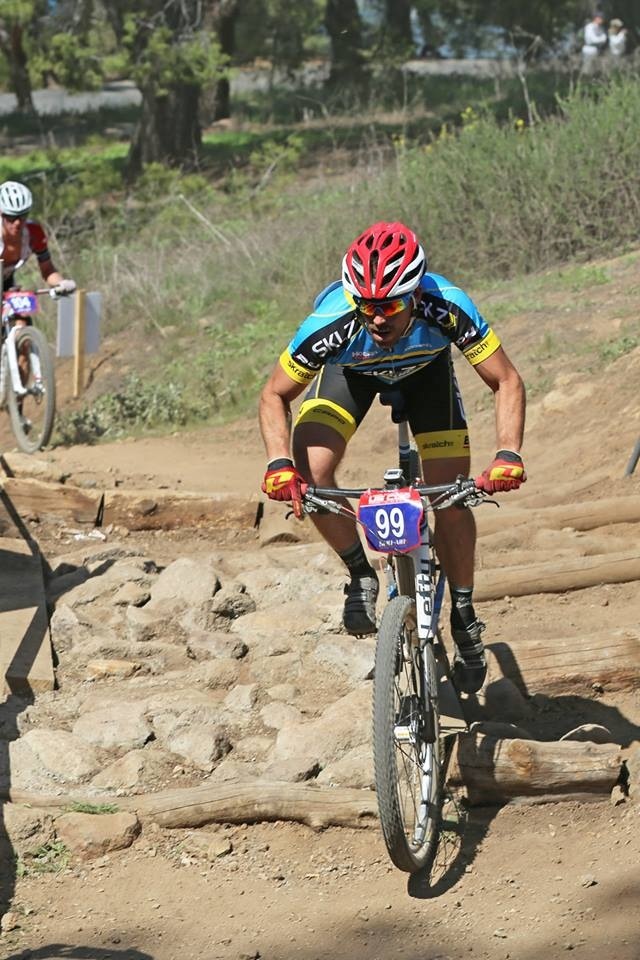
In contrast, a reasonable percentage of the total force generated by the lifting muscles is used by Elite and Pro level cyclists. You can notice that seemingly effortless pedaling with a very stable upper body in the large majority of those Pro cyclists. You can also notice that they do pedal at a high rpm rate consistent with the reliance on their aerobic system to produce power via their techniques. Elite and Pro cyclists lift approximately within  75% of the arc depending on the specific technique of the individual. Once they get to that point, they stop lifting and start pushing with the descending leg and sweep back through the bottom and up to that 75% of the arc. That complex actions is done without hesitation yet it takes a heck of  a lot of time and effort to get that delicate timing right. For some people it takes years to perfect that technique. Yet in doing so, as we have demonstrated with out testing, they leave 25% of the lifting power potential untapped.

The reason for that untapped lifting potential is that in order to achieve 100% adaptation of the lifting muscles, you have to train those muscles to lift effectively to their maximum limit. That is not done while combining lifting with pushing, no matter how efficient you are in doing so. Only when you commit exclusively to lifting will you be able to ultimately achieve that 100% lifting adaptation. That will take some mental rewiring to achieve  in order to overcome old pedaling habits. It takes three to four weeks to achieve reasonable adaptation with LPP yet its much easier than adapting to pulling and pushing. It will be easier to do LPP on wind assisted flats and on descents. Having said that, your past muscle memory will fight you when you are asked to continue lifting while overcoming a headwind on a flat or as the climbing gets tougher!

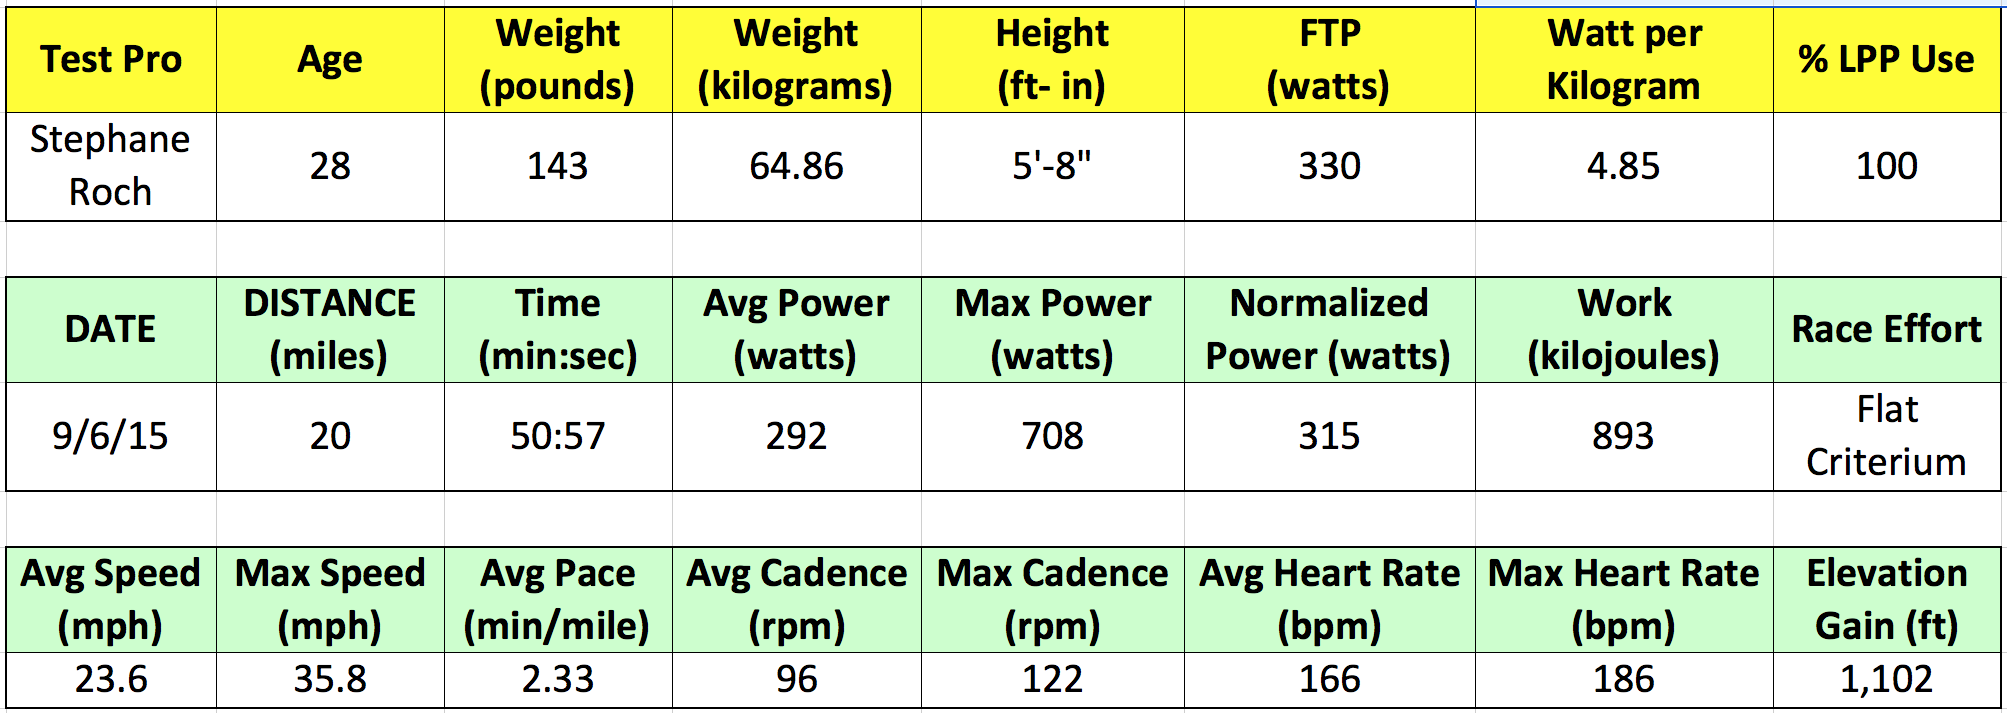
It is surprising to see how much power can be efficiently produced by fully adapted lifting muscles. Power enough to not to have to use those Quads unless it is absolutely necessary to engage them in support of the lifting muscles to perform very high power generation as the Pro cyclists do. Stephan can generate over 800 watts while sitting and  over 900 Watts standing. Consider how much will it mean for a triathlete  to have those Quads fully rested for the marathon phase and how beneficial will it be for a road cyclist to have the Quads fully rested to engage them on an attack or a final sprint.

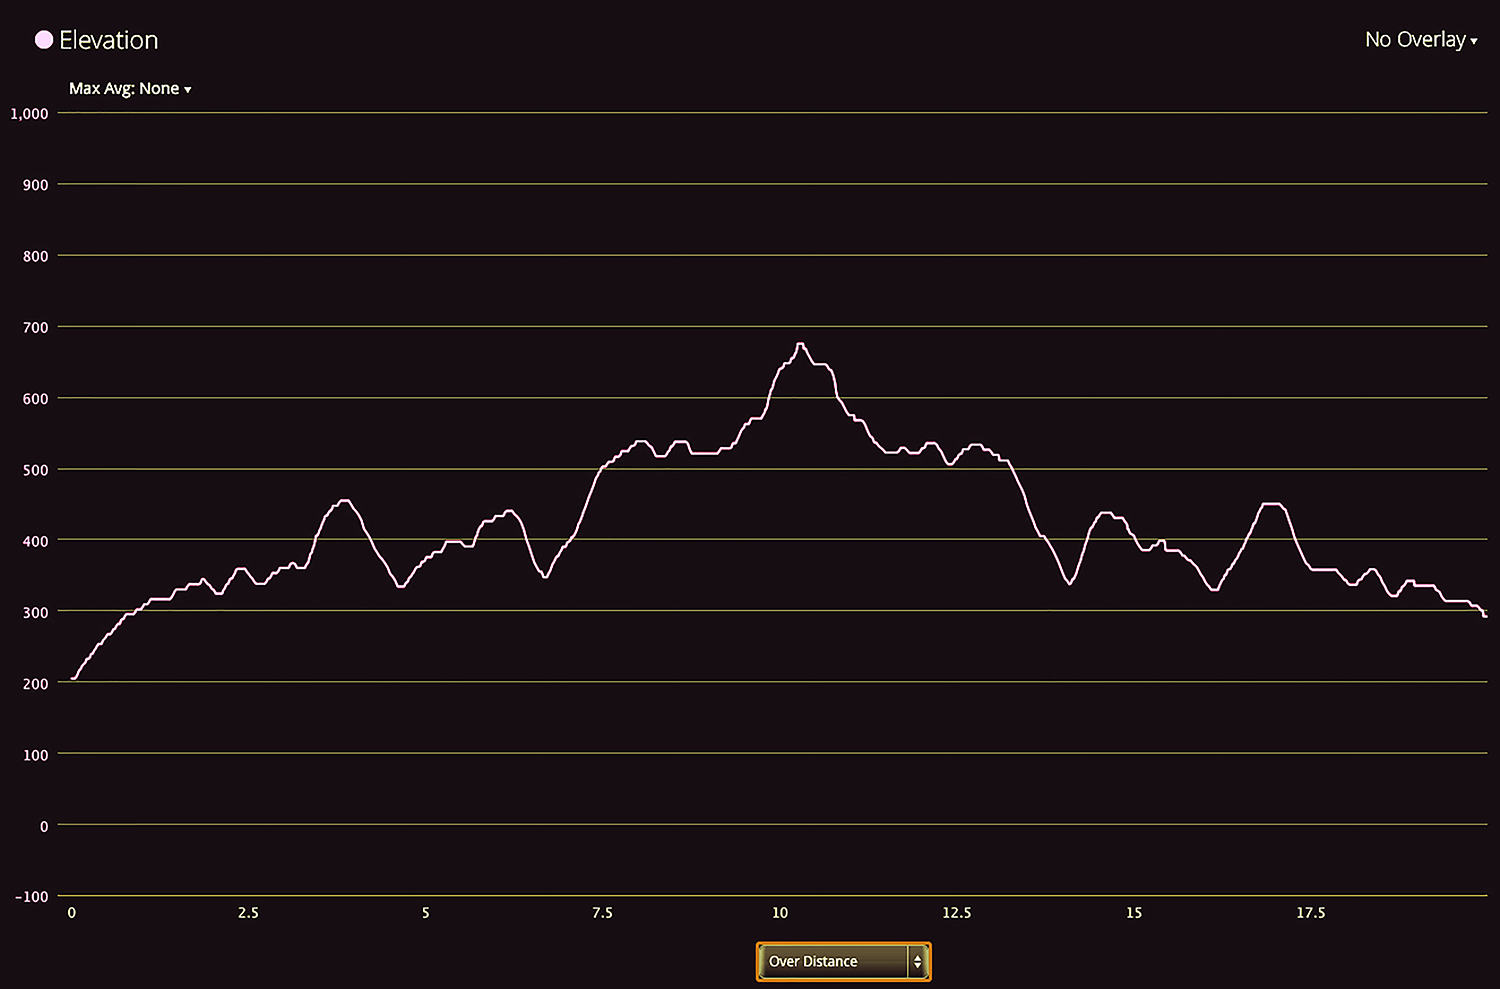
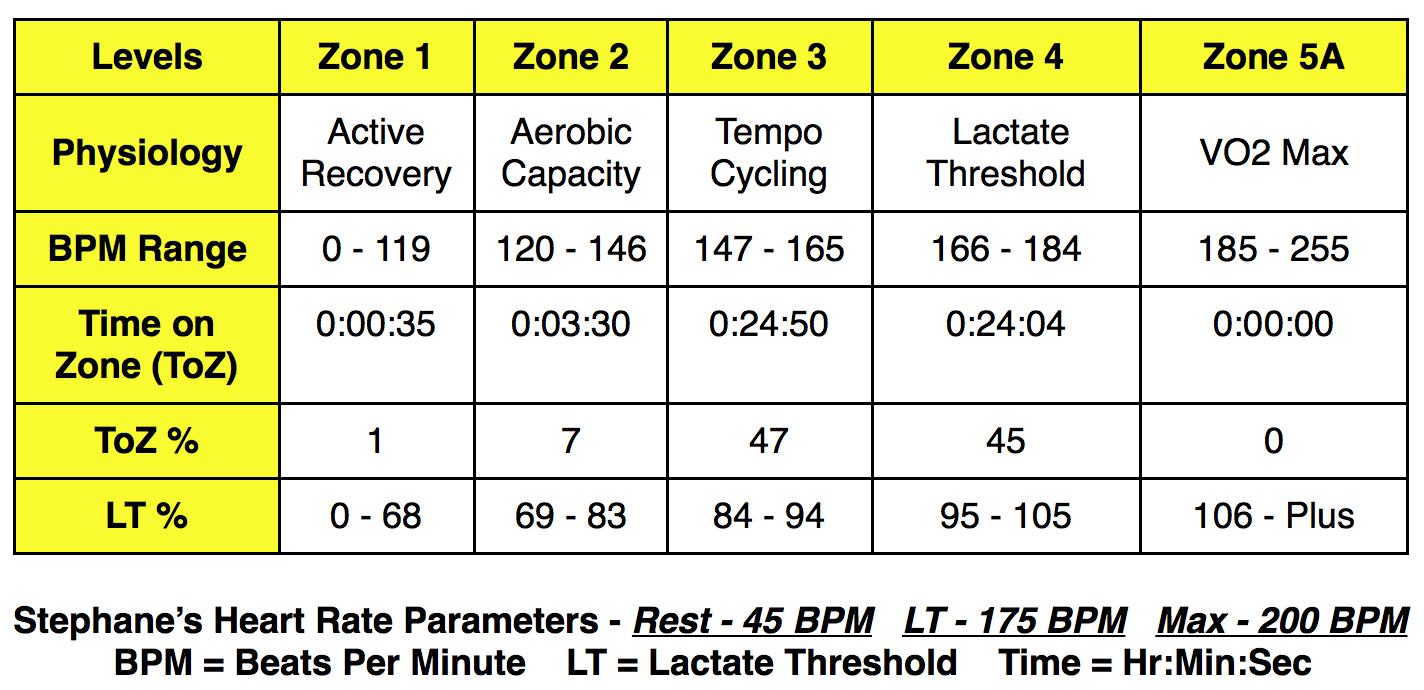
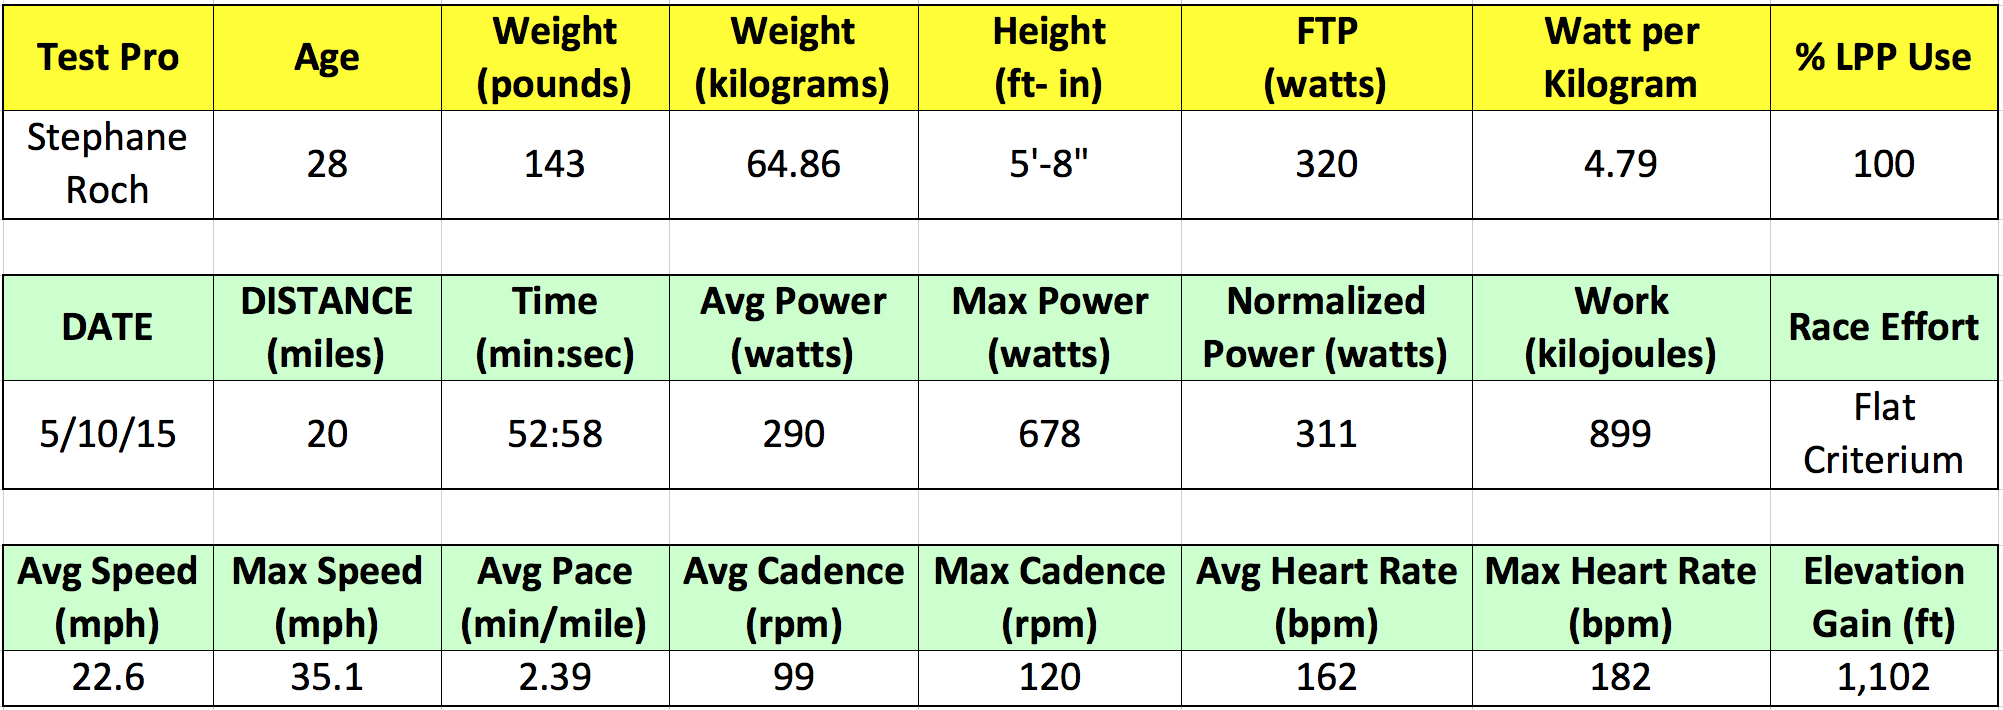
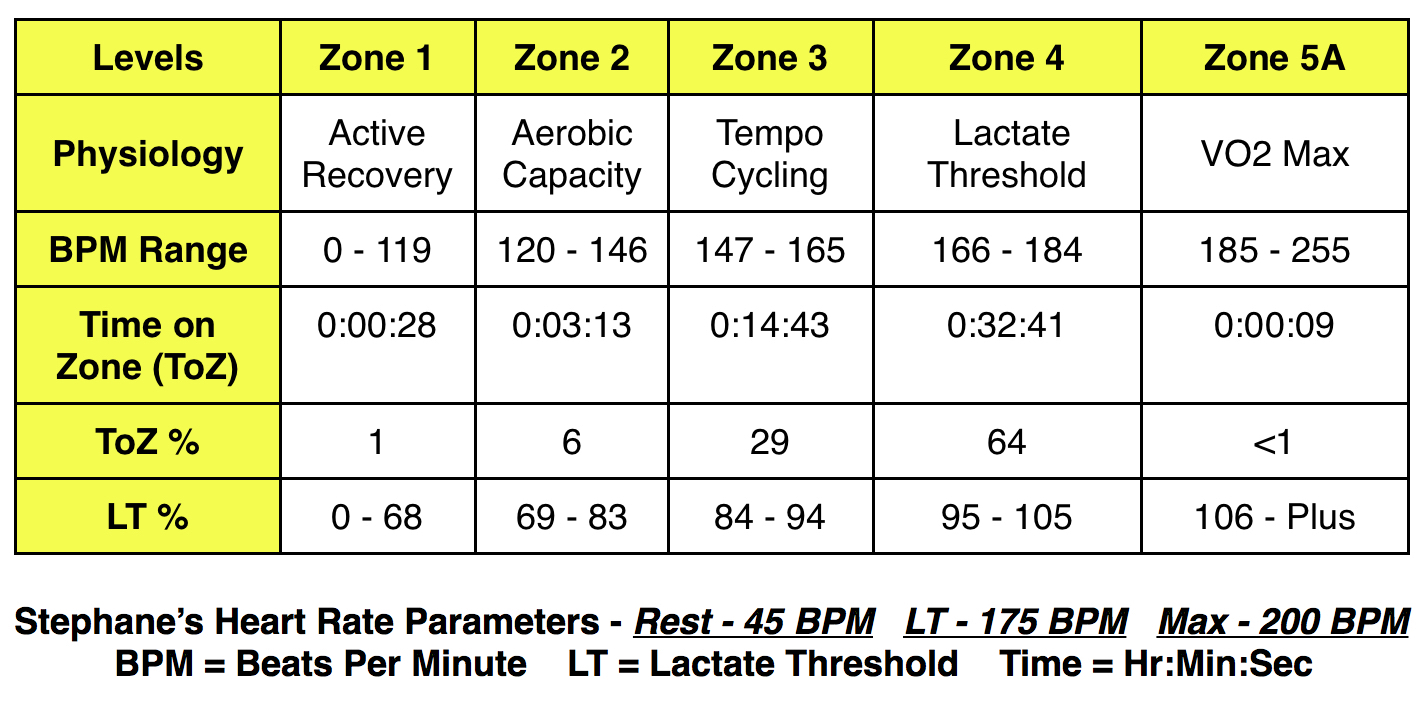
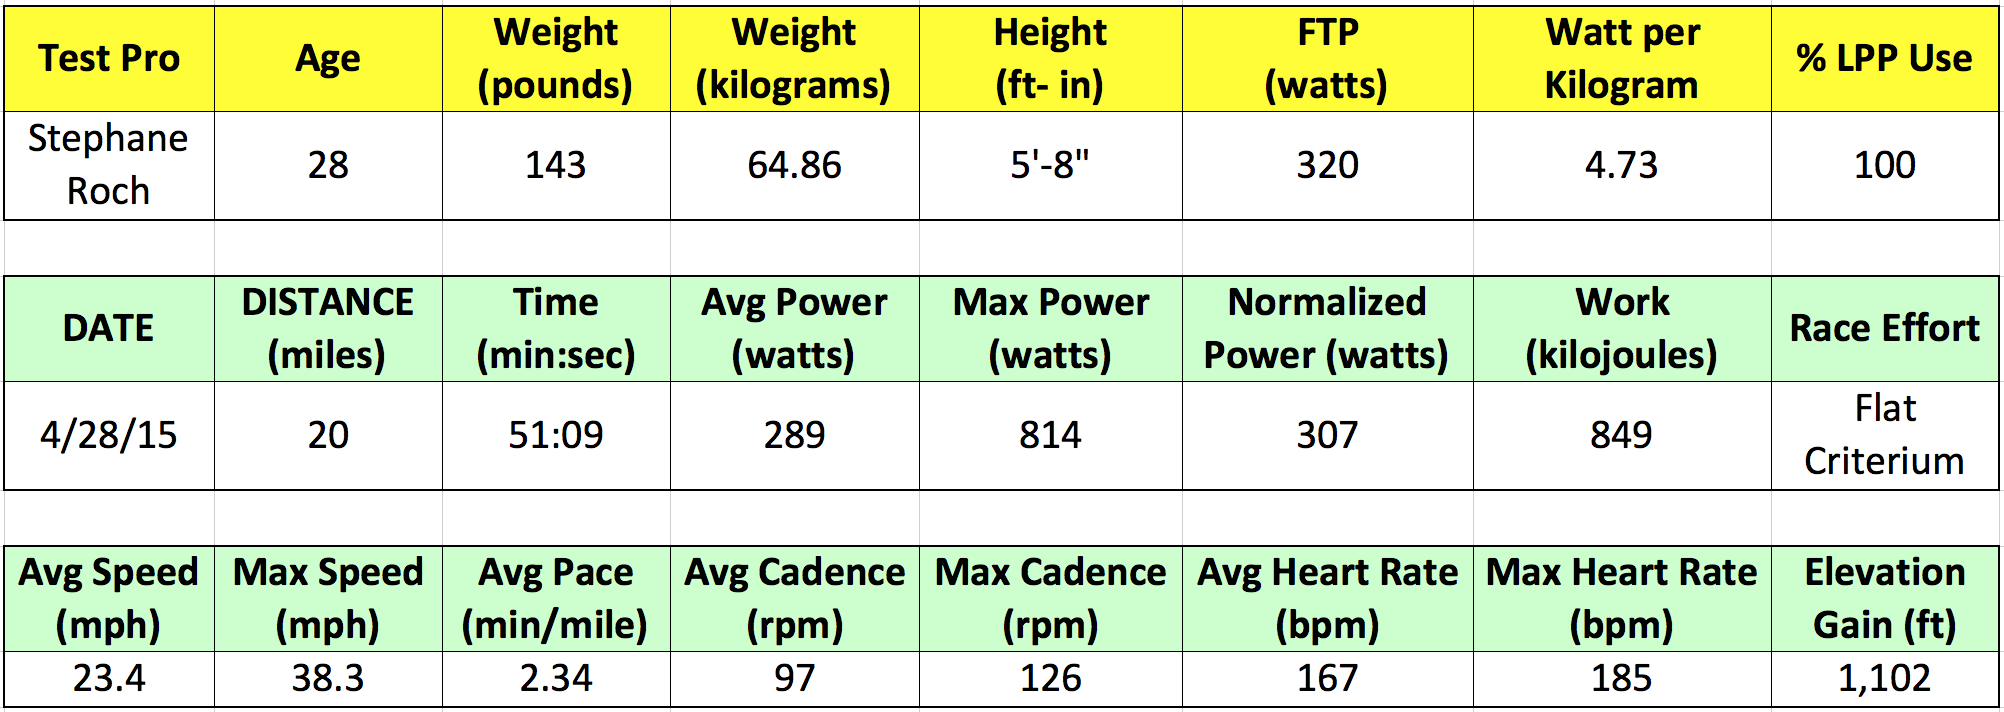
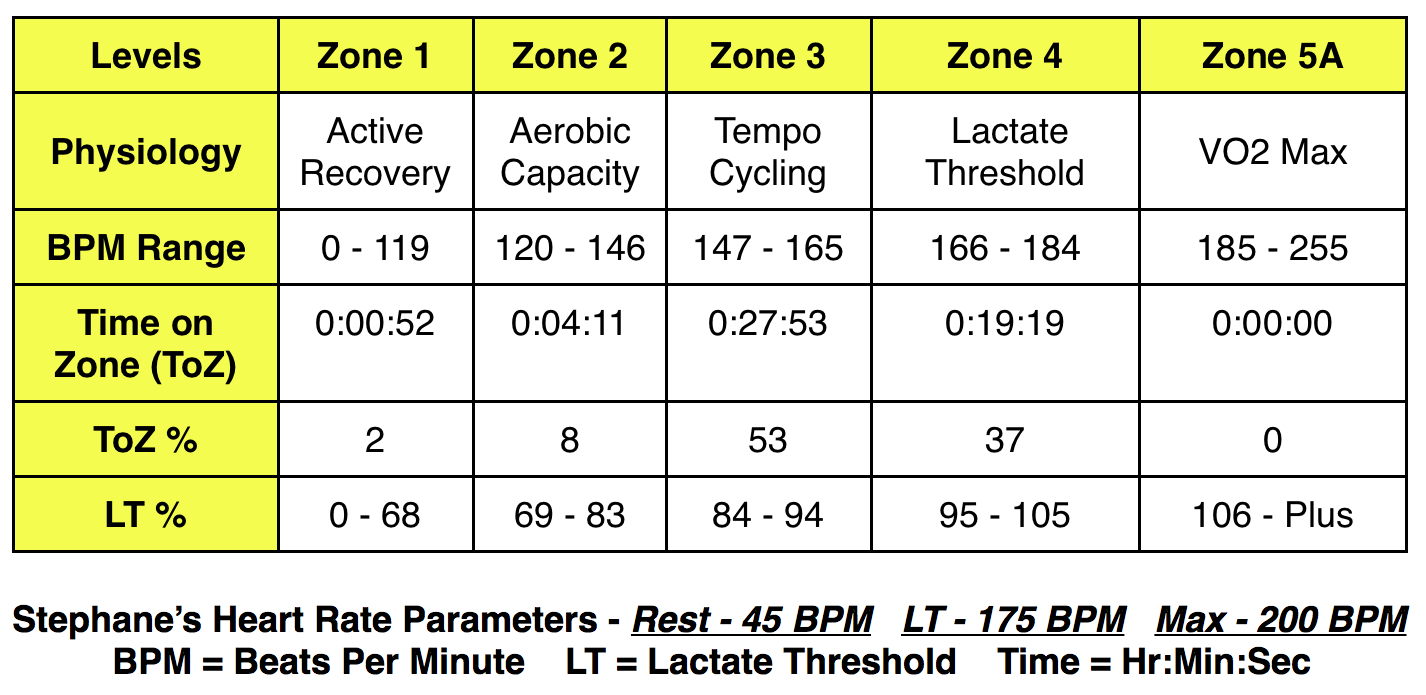
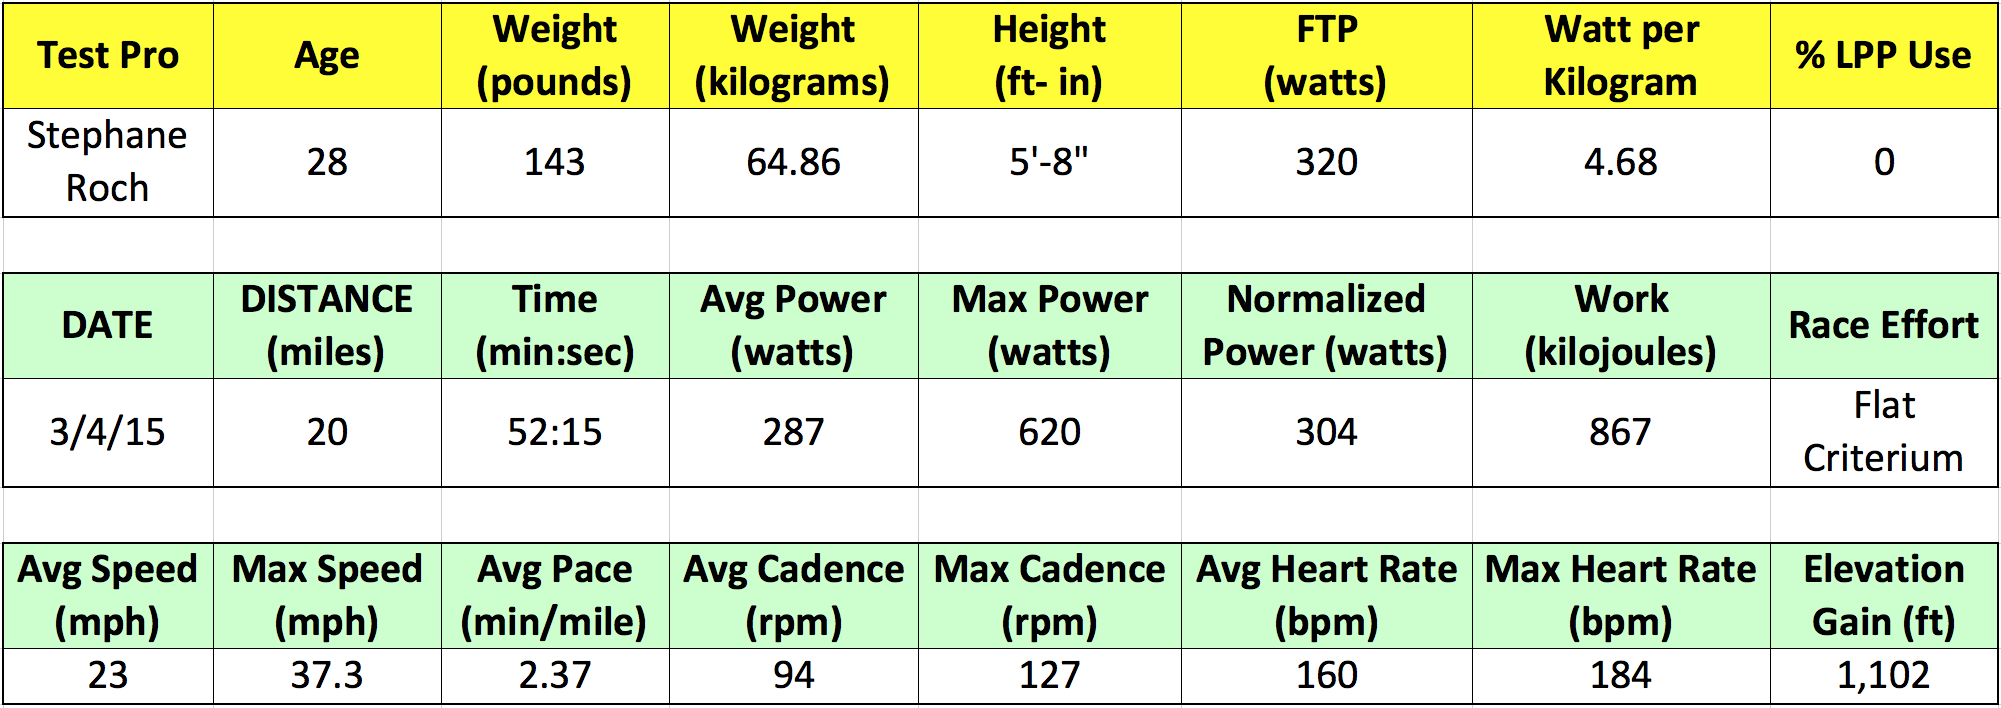
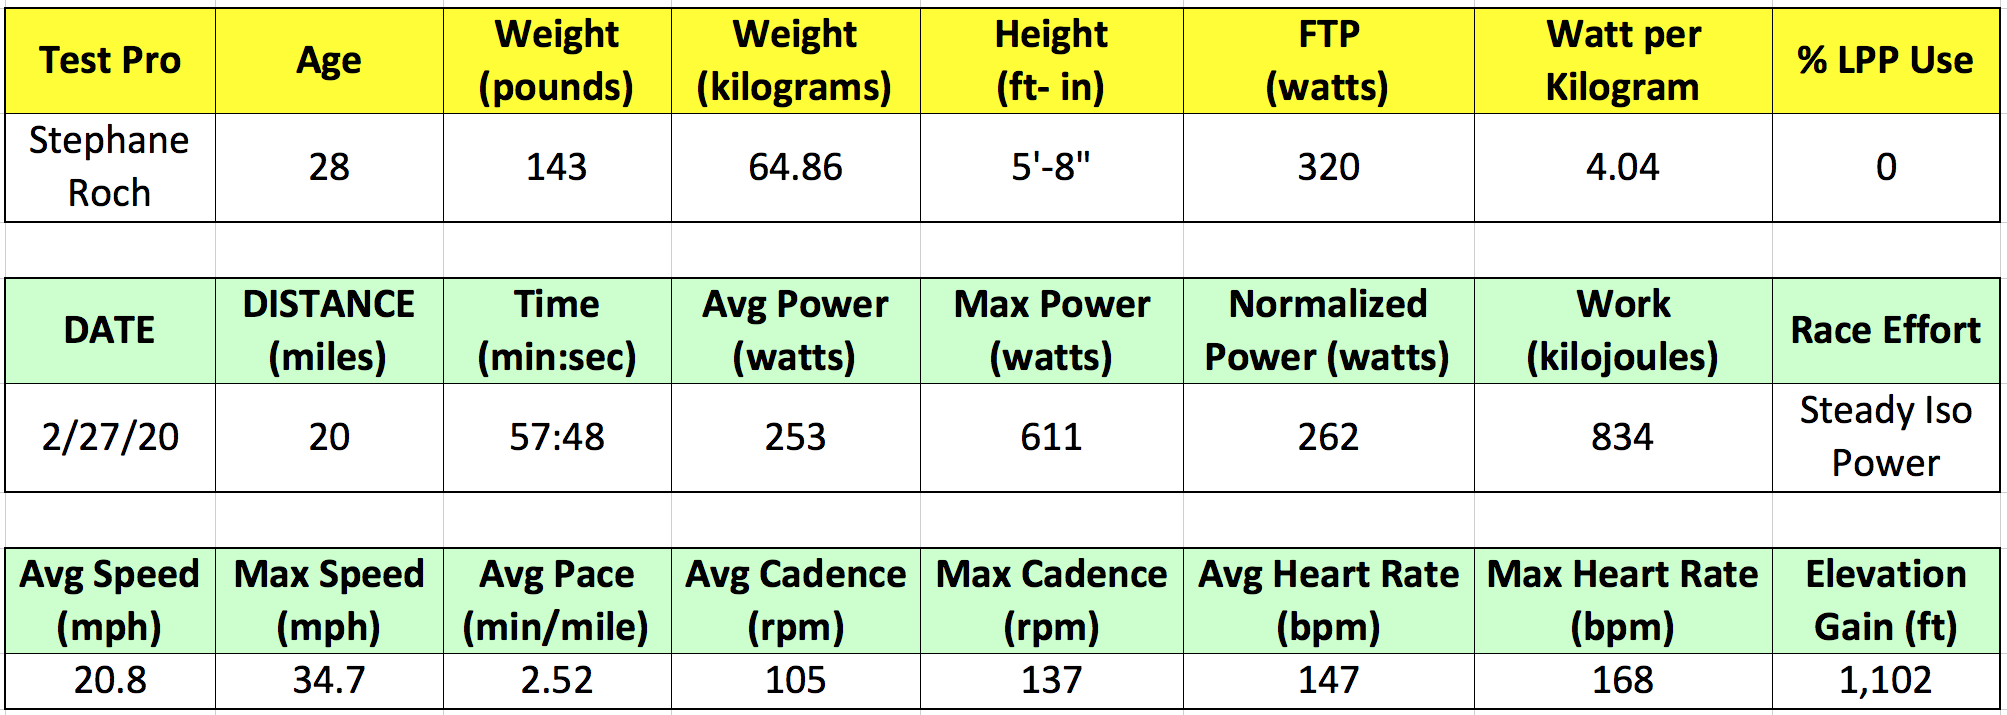
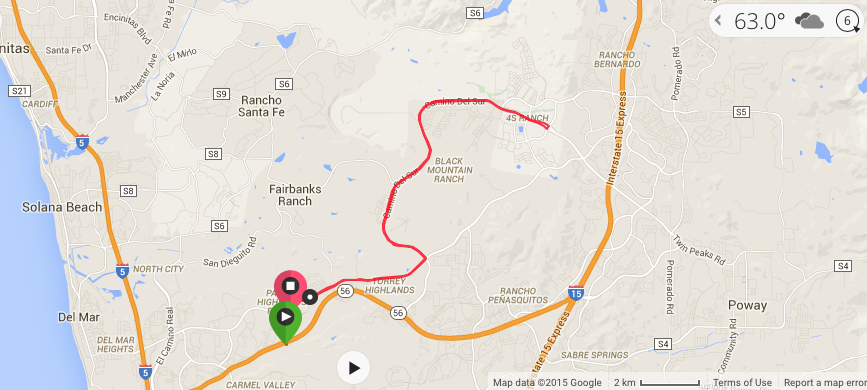
Testing across a fairly terrain diverse and demanding 20 mile test track clearly demonstrated that at 51 minutes and 9 seconds Stephane was able to improve 1 minute 9 seconds from his previous best time using his pro cycling technique, by using 99.9% pure lifting on the track with only some minor pulling/pushing on the standing starts. He did this improvement while spending 18 kilojoules less than during his previous best time effort. Both tests were performed on days that were extremely consistent relative to wind direction and calm wind conditions. In addition, the average temperature for the track varied by only 4 degrees between two test days and being in the 60’s it promoted a strong performance on both days. Stephane performed yet another 100% LPP test where he notched 50 minutes and 57 seconds on the track further lowering his best time. It is also interesting to see that he produced higher maximum wattage numbers in his pure LPP runs (814 Watts on the 51:09 run and 708 Watts on his 50:57 run on the saddle) when compared to the 620 Watts max on his 52:15 pro technique run.

Updated Comments (March 2022)

There is a fair amount of Physics (Kinetic Energy generation) that explains LPP lifting efficiency. We have hard empirical data that now we can complement with some hard math from the technical paper provided in within this website. The LPP Test Results section below is definitively cycling geeky but such geekiness is required to show cycling efficiency. As a gateway to it, I will leave you with these thoughts:

Comment #1 – In my mind, there is no doubt that Lift Propulsive Pedaling (LPP) should be the pedaling technique of choice for cyclists on the saddle, including Elite or Pro cyclist.  The benefits of the LPP technique come from the critical and necessary physical adaptation in order to take full advantage of the previously proven mechanical efficiency of the lifting technique (Refer to technical paper available within this website).

Comment #2 – As long as you can generate the pedaling power required on the saddle for your cycling needs and goals with LPP you don’t have to use any other technique. As Elite and Pro cyclists need to produce wattages beyond 900 watts, they should revert to their Pro technique. Those wattages will most likely be generated out of the saddle. The average wattage of a Pro during a race rarely exceeds 450 watts and that is well within the realm of LPP.

Comment #3 – There is more to LPP than meets the eye. There is a technique to be learned and adjustments that have to be done to your bike and cleats to get max performance from it. You can try to boldly go on your own, however, joining the http://www.LPPtraining.com website streamlines the process and I will always be available of coaching. My contact information is in that website, however, if you have any questions prior to joining, you can send me an email to joevilella@gmail.com. Make sure to title it LPP Queries so that it can survive my span blocker.

Sincerely,

Joseph Vilella, San Diego, CA, May of 2022

Post # 7 – LPP T3 – Third 100% Utilization of LPP (Please Review Test Results Postings in Sequential Order Starting with Post # 1)

LPP is Used 100% of the Time During the Test

The wind conditions of this test were similar to those of the previously logged fastest test where the wind was so mild as to not to be a factor. This test was performed less than two weeks after Stephane had come from the Leadville 100 race. He is fully adapted to the LPP technique and even though it could be argued that there could have been some level of performance degradation because of the fact that he had recently undergone such a severe mountain biking effort as the one the Leadville 100 posses, he was able to log a faster time than the one he previously logged. It is also important to note that this effort was done at a normalized power of 315 watts, which is only 5% watts off his FTP. His LPP technique continues to show improved results.

Test Results

Terrain Profile

Double Click on Image to Expand

Power Data Values

Test 5 - Power Zone Image
Double Click on Image to Expand for Clarity

Heart Rate Data Values

Test 5 - Heart Rate Zone Image
Double Click on Image to Expand for Clarity

Overall Performance Data

LPP 3

Third LPP Utilization Test 3 Summary (LLP T3)

The results speak for themselves. Improved test track performance with LPP! I like the fact that in this particular run, Stephane was able to generate 4 more watts of normalized power than in his crosswind run while using 6 kilojoules less of effort. I think it is safe to say that LPP has proven to be indeed a consistent high pedaling efficiency technique.

Post # 6 – Update of LPP Test Activities – Interim Post

To all interested Followers,

During the month of June and July, Stephane Roch had participated in several high profile Pro Mountain Bike racing events. He has notched two second and two fourth places in the process and has qualified for the notorious and extremely tough Leadville 100 race! He has informed me that he consistently uses LPP during his grueling training road work and as much as possible when the terrain patterns allow it during his Mountain Bike races.

Results from the Leadville 100 for Stephane were excellent. He took 56 overall out of 1400 participants in this brutal International event and made good use of LPP in the process. We start posting test results during the month of September as we continue our testing of the LPP technique.

Thanks and stay tuned!

Joseph Vilella

Off the Ascent at Rock Garden
Stephane Roch in Competition

Post # 5 – LPP T2 – Second 100% Utilization of LPP (Please Review Test Results Postings in Sequential Order Starting with Post # 1)

LPP is Used 100% of the Time During the Test

The conditions of this test were more difficult than those of the two previous tests because Stephane faced a moderate cross wind condition with a South-East component during the outbound portion of the track. This forced him to fight an angled headwind in portions of the test track that were exposed to it. As can be seen on the terrain profile image, the outbound portion of the track is where most of the climbing occurs, thus adding a wind stressor to an already challenging task. Even though the environmental circumstances required him to work harder to achieve the posted test time, the results produced a set of very positive values that were unexpected but very welcomed! Stephane used LPP 100% of the time throughout the test run and his level of adaptation to the technique is demonstrated by the quality of the test results.

Test Results

Terrain Profile

Test Track Terrain Profile Invert
Double Click on Image to Expand

The Cross wind impact was felt at different sections of the profile between miles 1 and 8.

Power Data Values

Test 4 - Power Zones Image
Double Click on Image to Expand for Clarity

Heart Rate Data Values

Test 4 - Heart Rate Zones Image
Double Click on Image to Expand for Clarity

Overall Performance Data

LPP 2

Second LPP Utilization Test Summary (LPP T2)

What is interesting about this Test run is that although it’s time became third out of the three fast runs ( The test times were 51:09 for LPP Run 1 (LPP T1), 52:15 for Baseline Fast Run 2 (BFR 2) and 52:58 for LPP T2), the actual power generation and all related performance factors were the highest for LPP T2, while the heart rate values for this test run were the second lowest for Heart Rate Average and the lowest for Max Heart Rate of the three runs. It is important to note that the difference in watts of Normalized Power (NP) between the fastest runs was 3 watts with LPP T1 at 307 watts and BFR 2 at 304 watts, which accounted for over 1 minute of speed increase between then. LPP T2 yielded the highest NP wattage yet it was 1 minute and 48  seconds slower when compared to the time of LPP T1. it is also important to note that LPP T1 and BFR 2 were performed in wind conditions that were light enough to not to be a factor during the performance of the tests. This was not the case of LPP T2, where the wind was crossed with a headwind component of moderate and varied in intensity.

My sense is that Stephane was forced to adapt to variances of angular headwind conditions and pace himself within that framework to a best possible time that allowed him to move fast and finish strong. When the results were analyzed, the Variability Index (Normalized Power/Average Power) indicated that at 1.07 this performance factor had exceeded that of the two previous runs and became indicative of race efforts found in a Flat Criterium even though Stephane climbed 1,066 feet in the process. I’m fairly certain that under similar environmental circumstances to that of the LPP T1 and BFR 2 runs, this run could have yielded a time at or below the 50 minutes mark. We shall see how low Stephane can go under similar circumstances to those of LPP T1 and BFR 2.

Post # 4 – LPP T1 – First 100% Utilization of LPP (Please Review Test Results Postings in Sequential Order Starting with Post # 1)

LPP is Used 100% of the Time During the Test

Having had a considerable adaptation time  prior to this test, Stephane was asked to use LPP exclusively during this test run. For this he was provided specific pointers that allowed him to fully isolate LPP from his Pro pedaling technique. Stephane used the LPP technique with the active muscular pedaling force being applied from the 6 to the 12.5 o’clock of the upstroke and without the active use of the Quad muscle group.  As I’m sitting writing this post today, I remember how I felt that day. I had a complete sense of acceptance of whatever the results would be. I had developed LPP to help the pure “pedal pushers” at no matter what level of cycling, to get faster and more efficient with less pain. For LPP to be integrated in whatever manner it could,  into higher levels of cycling was for me truly a bonus!  The last thing I told Stephane was to pedal hard but be very focussed on staying LPP pure across the test. To be sure to not to sacrifice technique in the pursuit of speed. To choose the standing and sitting sequencing as well as the RPM progression that would allow him to maintain a solid LPP technique and to let the results fall wherever the did. The following are the test results.  Please click on “Continue Reading —>” if the Overall Performance Data Chart and the Test Summary are not readily displayed for your viewing.

Test Results

Terrain Profile

Test Track Terrain Profile Invert
Double Click on Image to Expand

Power Data Values

Test 3 Power Zones
Double Click on Chart to Expand for Clarity

Heart Rate Data Values

Test 3 Heart Rate Zones
Double Click on Chart to Expand Clarity

Overall Performance Data

LPP 1

First LPP Utilization Test Summary (LPP T1)

Once the test was completed, the first indication of an LPP breakthrough was the time to complete the course, which at 51:09 ended up being 1 minute and 6 seconds faster than the 52:15 of  Second Baseline Track Speed Test. That was a welcome surprise for both Stephane and myself. He also reported absolutely no discomfort, soreness or pain in the QUADs. That indicated that he had gone LPP pure.  It was later, when I collected and analyzed the data that a couple of additional nice surprises sprung out the test results.

Detailed analysis showed that all the values that contributed to the speed increase were up from those of LPP Test 2. The Normalized Power went up to 307 Watts from the previous 304 Watts and at 96% of FTP utilization, the 307 Watts value was 4% or 13 Watts off from Stephane’s 320 Watts FTP. The Average Cadence went up from 94 to 97 RPM, consistent with a high level cycling cadence and the Average Heart Rate value went 7 beats up from that of the previous test. What was surprising is that both the Test TSS and the Work values were down from those of the previous test! The TSS value was 73.4 was a reduction from the 74.5 value of the previous test. Moreover,  a parameter indicative of comparative pedaling efficiency, which is the Work in Kilojoules measured by the power meter, and is indicative of the energy that Stephan used to turn those pedals, was 849 Kilojoules for this test and  867 Kilojoules for the previous test. A difference of 18 Kilojoules less of work for 1 mile an hour more of Average Moving Speed!

Post # 3 – BFR 2 – Second Baseline Track Speed Test (Please Review Test Results Postings in Sequential Order Starting with Post # 1)

This baseline speed test was used to confirm that the results of the fist speed run were fairly consistent. Stephane was asked to do his best effort to improve match or improve his first speed test run. The following results were derived from his effort. Please click on “Continue Reading —>” if the Overall Performance Data Chart and the Test Summary are not readily displayed for your viewing.

Test Results

Terrain Profile

Test Track Terrain Profile Invert
Double Click on Image to Expand

Power Data Values

Test 2 Power Zones
Click on Chart to Expand for Clarity

Heart Rate Data Values

Test 2 Heart Rate Zones
Double Click on Chart to Expand for Clarity

Overall Performance Data

BFR 2

Second Speed Test Run Summary

Stephane was able to achieve an effort consistent with that of a Hill Climbing Time Trial or a Flat Criterium. At a value of 304 Watts, his Normalized Power for the test was equivalent to 95% of his Functional Threshold Power output of  320 Watts. There was no question that he produced a very strong effort during the test. His intensity factor was at Lactate Threshold and his Training Stress Test score was 74.5. He generated a pedaling work value of 867 Kilojoules.  This run was going to be fundamental in order to compare it to an LPP test run in order to assess the its LPP’s efficiency at a race pace performance level.

Post # 2 – BFR 1 – First Baseline Track Speed Test (Please Review Test Results Postings in Sequential Order Starting with Post # 1)

LPP Baseline Test on Track #1 

For this fist test, Stephane was asked to go through the test track as fast as possible. He used his pedaling technique for this effort to establish a baseline test time. . We used the Garmin Connect and Training Peaks data analysis platforms to provide the results. We based the performance zones on the Coggan Power and Heart Rate Zones method. This method relies on power and heart rate at Lactate Threshold to derive the performance metrics. Please click on  “Continue Reading —>”  if the Overall Performance Data Chart and the Test Summary are not readily displayed for your viewing.

Test Results 

Terrain Profile

Test Track Terrain Profile Invert
Double Click on Chart to Expand

Power Data Values

Test 1 Power Zones
Double Click on Chart to Expand

Heart Rate Data Values

Test 1 Heart Rate ZonesDouble Click on Image to Expand for Clarity

Overall Performance Data

BFR 1

First Baseline Track Speed Test Summary

The results of this first test clearly show the competitive power generation capacity of this technique at a level that hit the 6 power zones, while producing a Normalized power value mid range within the Tempo Zone yet with an average heart rate level at the lowest possible value of the Tempo Zone. Power generation up to 600 watts with sustained segments upward of 300 watts were not problematic to achieve. When analyzed from an overall performance level, even the Intensity Factor (IF) value was consistent with the upper limits of the Endurance zone, which meant that Stephane could have pushed the technique harder, however, the intent was to baseline the technique in a conservative and bounded manner before demanding more of it. That was clearly achieved.

Post # 1 – Anatomy of LPP Test Track # 1

LPP Test Track # 1

LPP Test Track 1 Map
Double Click on Image to Expand

The first LPP track of our performance testing is a 20 mile segment that has a variety of terrain that adds approximately 1,100 feet of vertical ascent. The track is in North San Diego. It starts at the Intersection of Carmel Valley Road and I-56, follows Carmel Valley Road to Camino Del Sur. The track continues on Camino Del Sur as it changes name to Camino del Norte on the intersection of Rancho Bernardo Road. The track now continues on Camino del Norte until it loops back on the intersection of Camino San Bernardo. For the first 10 miles, the Pro Test Rider is mostly ascending with a maximum gradient of 5.5% prior to the intersection of Carmel Valley Road and Camino del Sur. The returning 10 miles are mostly descending , yet there is rolling terrain as well as two longish ascent efforts. The maximum ascent gradient on the way back is 6.5%.

Test Track Terrain Profile

Test Track Terrain Profile Invert
Double Click on Graphic to Expand

There are several intersections with traffic lights across the track. That is one of the vagaries of the road so we deal with them as best as possible. Our goal is to do the testing under realistic cycling conditions so that data is looked at, internalized and appreciated from that perspective, not from an ideal scenario that does not match cycling reality. The bottom line is that the results of the tests on this track are conservative and could have yielded higher performance results under ideal conditions such as with minimal or no need to stop for traffic lights.